Images become iconified, with the image representing an object or
phenomena, but this happens by enculturation rather by training. An
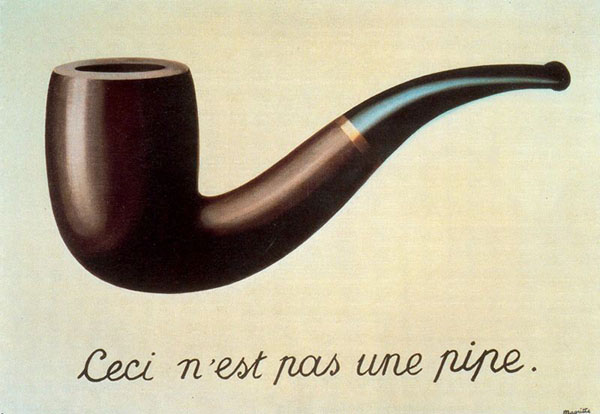
example to elaborate this notion is the painting Treachery of
Images by Belgian surrealist artist René Magritte. The painting is
also sometimes called This is not a pipe. The picture shows a
pipe, and below it, Magritte painted, “Ceci n’est pas une pipe.”,
French for “This is not a pipe.”
When one looks at the painting, one
exclaims “Of course, it is a pipe! What is the painter trying to say
here? We can all see that it is indeed a pipe, only a fool will claim
otherwise!” But then this is what Magritte has to say:
The famous pipe. How people reproached me for it! And yet, could you
stuff my pipe? No, it’s just a representation, is it not? So if I had
written on my picture `This is a pipe’, I’d have been lying!
Aha! Yess! Of course!! you say. “Of course it is not a pipe! Of
course it is a representation of the pipe. We all know that! Is this
all the painter was trying to say? Its a sort of let down, we were
expecting more abstract thing from the surrealist.” We see that the
idea or concept that the painting is a \emph{representation} is so
deeply embedded in our mental conceptual construct that we take it for
granted all the time. It has become so basic to our everyday social
discourse and intercourse that by default we assume it to be so. Hence
the confusion about the image of the pipe. Magritte exposes this
simple assumption, that we so often ignore. This is true for all the
graphics that we see around us. The assumption is implicit in all the
things we experience in the society. The representation becomes the
thing itself, for it is implicit in the way we talk and communicate.
Big B and D
When you look at a photo of something or someone, you recognize
it. “This is Big B!” you say looking at the painting! But then you
have already implicitly assumed that the representation of Big B is Big B. This implicit assumption comes from years of implicit training from being submerged in the sea of the visual artefacts that surround and drown us. This association between the visual representation and the reality it represents had become the central theme of the visual culture that we live in. The training that we need for such an association comes from the peers and mentors that surround us from the childhood. The meaning and the association of the images is taught/caught over the years, so much so that we assume the abstract association is the normal way things are. In this way it becomes the implicit truth, though when one is pressed, the explicit connections are brought out.
Yet when it comes to understanding images in science and mathematics, the same thing doesn’t happen. There is no enculturation of children into understand the implicit meaning in these images. Hardly there are no peers or mentors whose actions and practices can be imitated by the young impressible learners. The practice which comes so naturally in other domains (identifying actor with a picture of the actor, or identifying a physical space with a photo) doesn’t happen in science and mathematics classrooms. The notion of practice is dissociated from the what is done to imbibe this understanding in the children. A practice based approach where the images become synonymous with their implied meaning is used in vocabulary might one very positive way out, this is after all practitioners of science and mathematics learn their trade.