How big is the shadow of the Earth?


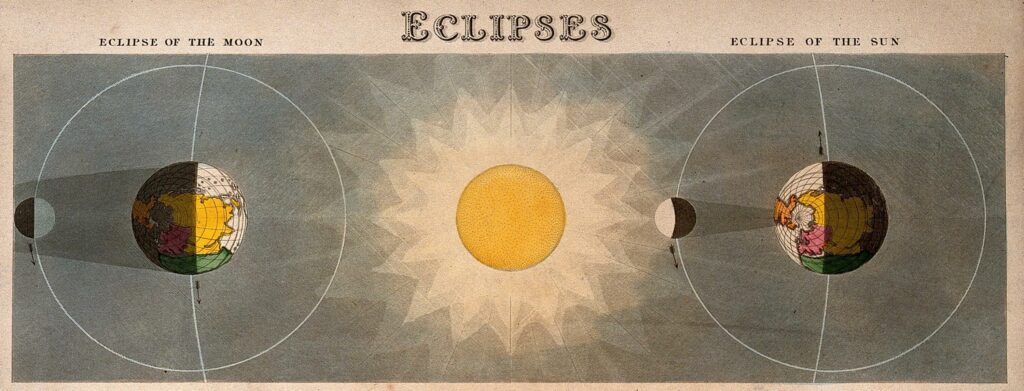
The Sun is our ultimate light source on Earth. The side of the Earth facing the Sun is bathed in sunlight, due to our rotation this side changes continuously. The side which faces the Sun has the day, and the other side is the night, in the shadow of the entire Earth. The sun being an extended source (and not a point source), the Earth’s shadow had both umbra and penumbra. Umbra is the region where no light falls, while penumbra is a region where some light falls. In case of an extended source like the Sun, this would mean that light from some part of the Sun does fall in the penumbra.  Occasionally, when the Moon falls in this shadow we get the lunar eclipse. Sometimes it is total lunar eclipse, while many other times it is partial lunar eclipse. Total lunar eclipse occurs when the Moon falls in the umbra, while partial one occurs when it is in penumbra. On the other hand, when the Moon is between the Earth and the Sun, we get a solar eclipse. The places where the umbra of the Moon’s shadow falls, we get total solar eclipse, which is a narrow path on the surface of the Earth, and places where the penumbra falls a partial solar eclipse is visible. But how big is this shadow? How long is it? How big is the umbra and how big is the penumbra? We will do some rough calculations, to estimate these answers and some more to understand the phenomena of eclipses.

We will start with a reasonable assumption that both the Sun and the Earth as spheres. The radii of the Sun, the Earth and the Moon, and the respective distances between them are known. The Sun-Earth-Moon system being a dynamic one, the distances change depending on the configurations, but we can assume average distances for our purpose.

[The image above is interactive, move the points to see the changes. This construction is not to scale!. The simulation was created with Cinderella ]


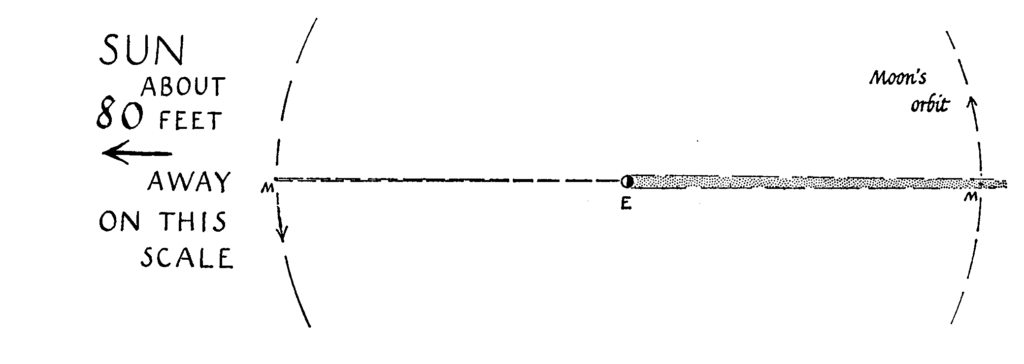
The diameter of the Earth is approximately 12,742 kilometers, and the diameter of the Sun is about 1,391,000 kilometers, hence the ratio is about 109, while the distance between the Sun and the Earth is about 149 million kilometers. A couple of illustrations depicting it on the correct scale.


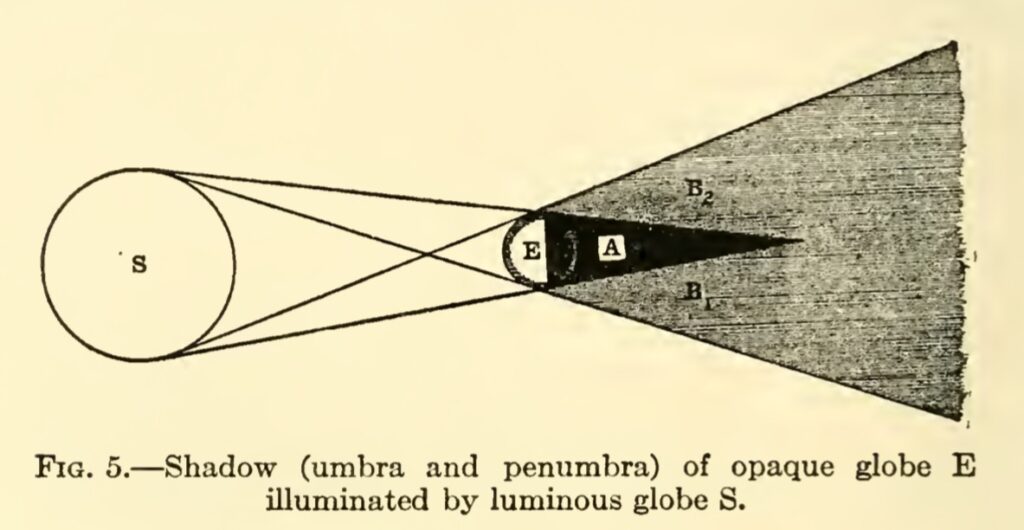
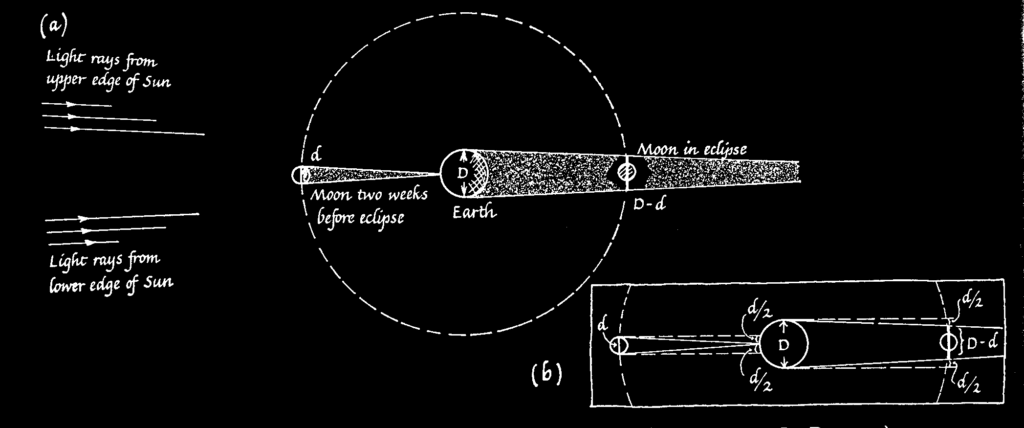
The Sun’s (with center A) diameter is represented by DF, while EG represents Earth’s (with center C) diameter. We connect the centers of Earth and Sun. The umbra will be limited in extent in the cone with base EG and height HC, while the penumbra is infinite in extent expanding from EG to infinity. The region from umbra to penumbra changes in intensity gradually. If we take a projection of the system on a plane bisecting the spheres, we get two similar triangles HDF and HEG. We have made an assumption that our properties of similar triangles from Euclidean geometry are valid here.

In the schematic diagram above (not to scale) the umbra of the Earth terminates at point H. Point H is the point which when extended gives tangents to both the circles. (How do we find a point which gives tangents to both the circles? Is this point unique?). Now by simple ratio of similar triangles, we get

$$
\frac{DF}{EG} = \frac{HA}{HC}  = \frac{HC+AC}{HC}
$$

Therefore,

$$
HC = \frac{AC}{DF/EG -1}
$$

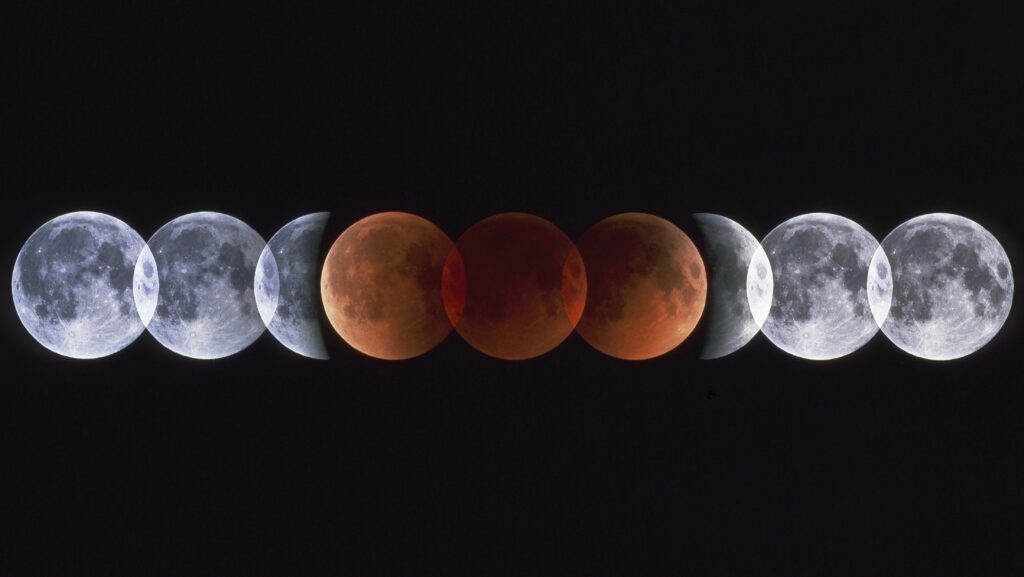
Now, $DF/EG = 109$, and $AC$ = 149 million km,  substituting the values we get the length of the umbra $HC \approx$  1.37 million km. The Moon, which is at an average distance of 384,400 kilometers,  sometimes falls in this umbra, we get a total lunar eclipse. The composite image of different phases of a total lunar eclipse below depicts this beautifully. One can “see” the round shape of Earth’s umbra in the central three images of the Moon (red coloured) when it is completely in the umbra of the Earth (Why is it red?).

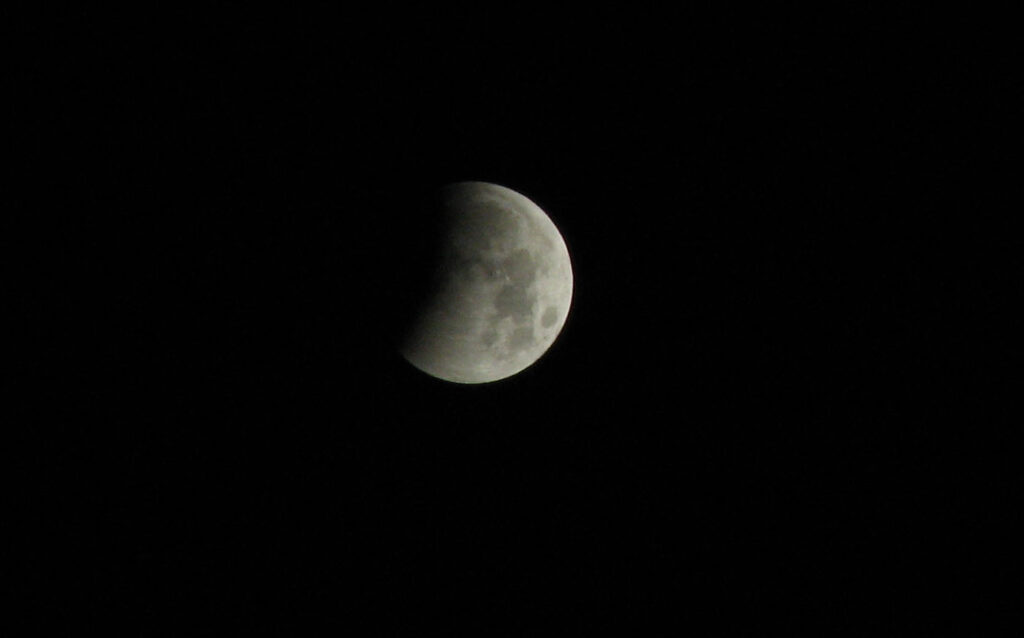
When only a part of umbra falls on the moon we get a partial lunar eclipse as shown below. Only a part of Earth’s umbra is on the Moon.

So if the moon was a bit further away, lets say at 500,000 km, we would not get a total solar eclipse. Due to a tilt in Moon’s orbit not every new moon is an eclipse meaning that the Moon is outside both the umbra and the penumbra.

The observations of the lunar eclipse can also help us estimate the diameter of the Moon.

Similar principle applies (though the numbers change) for solar eclipses, when the Moon is between the Earth and the Sun. In case of the Moon, ratio of diameter of the Sun and the Moon is about 400. With the distance between them approximately equal to the distance between Earth and the Sun. Hence the length of the umbra using the above formula is 0.37 million km or about 370,000 km. This makes the total eclipse visible on a small region of Earth and is not extended, even the penumbra is not large (How wide is the umbra and the penumbra of the moon on the surface of the Earth?).

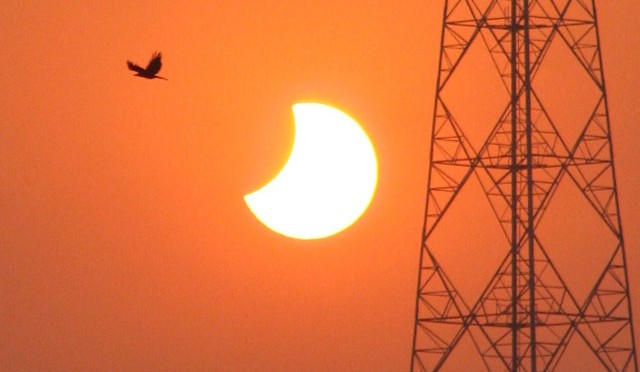
When only penumbra is falling on a given region, we get the partial solar eclipse.

You can explore when solar eclipse will occur in your area (or has occurred) using the Solar Eclipse Explorer.

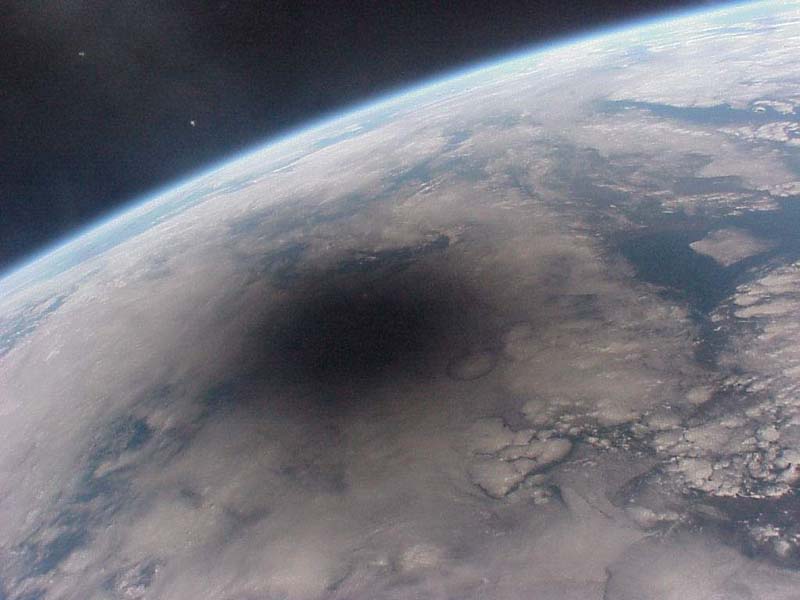
This is how the umbra of the Moon looks like from space.

And same thing would happen to a globe held in sunlight, its shadow would be given by the same ratio.

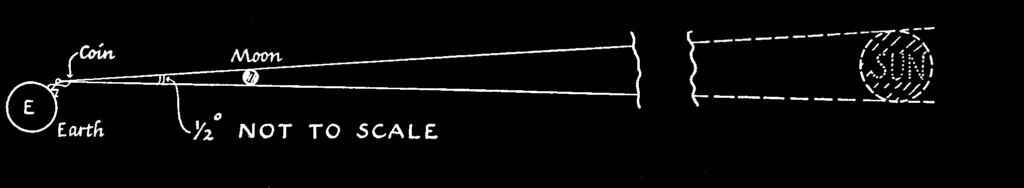
Thus we see that the numbers are almost matched to give us total solar eclipse, sometimes when the moon is a bit further away we may also get what is called the annular solar eclipse, in which the Sun is not covered completely by the Moon. Though the total lunar eclipses are relatively common (average twice a year) as compared to total solar eclipses (once 18 months to 2 years). Another coincidence is that the angular diameters of the Moon and the Sun are almost matched in the sky, both are about half a degree (distance/diameter ratio is about 1/110). Combined with the ratio of distances we are fortunate to get total solar eclipses.

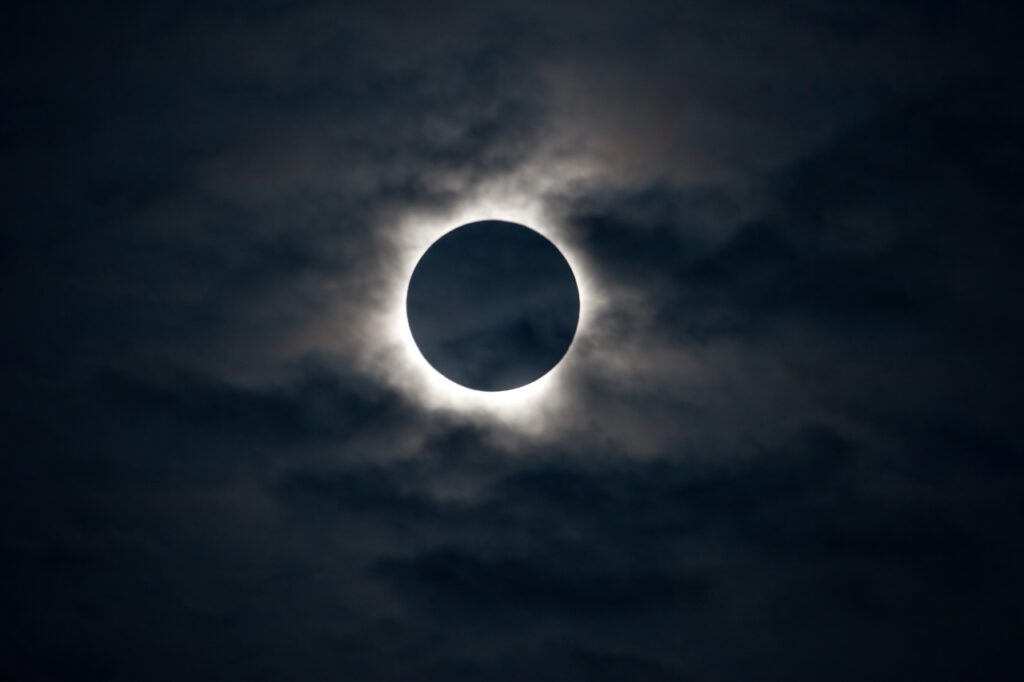
Seeing and experiencing a total solar eclipse is an overwhelming experience even when we have an understanding about why and how it happens. More so in the past, when the Sun considered a god, went out in broad daylight. This was considered (and is still considered by many) as a bad omen. But how did the ancient people understand eclipses?  There is a certain periodicity in the eclipses, which can be found out by collecting large number of observations and finding patterns in them. This was done by ancient Babylonians, who had continuous data about eclipses from several centuries. Of course sometimes the eclipse will happen in some other part of the Earth and not be visible in the given region, still it could be predicted.   To be able to predict eclipses was a great power, and people who could do that became the priestly class. But the Babylonians did not have a model to explain such observations. Next stage that came up was in ancient Greece where models were developed to explain (and predict) the observations. This continues to our present age.

The discussion we have had applies in the case when the light source (in this case the Sun) is larger than the opaque object (in this case the Earth). If the the light source is smaller than the object what will happen to the umbra? It turns out that the umbra is infinite in extent. You see this effect when you get your hand close to a flame of candle and the shadow of your hand becomes ridiculously large! See what happens in the interactive simulation above.

References

James Southhall Mirrors, Prisms and Lenses (1918) Macmillan Company

Eric Rogers Physics for the Inquiring Mind (1969) Princeton


Remarkable Curves 1: The Straight Line and the Circle


The Straight Line and the circle

(Note: All the images are interactive, move the points around to see. Dynamic mathematics interactive web page with Cinderella )

A moving point describes a straight line when it passes from one
position to another along the shortest possible path. A straight line
can be drawn with the help of a ruler; when a pencil runs along the
edge of a ruler it leaves a trace on the paper in the form of a
straight line.

When a point moves on a surface at a constant distance from another
fixed point on the same surface it describes a circle. Because of this
property of the circle we are able to draw a circle with the help of
compasses.

The straight line and the circle are the simplest and at the same time
the most remarkable curves as far as their properties are concerned.

You are no doubt more familiar with these two curves than with
others. But you should not imagine that you know all of the most
important properties of straight lines and curves. For example, you
may not know that if the vertices of the triangles $ABC$ and $AB’C’$
lie on three straight lines intersecting at the point $S$ (Fig. 1),
the three points of intersection $M$, $K$, $L$ of the corresponding
sides of the triangles, the sides $AB$ and $A’B’$, $BC$ and $B’C’$,
and $AC$ and $A’C’$, must be collinear, that is, they lie on a single
straight line.

(Note: this image below is interactive, move the points to see the dynamic change!)

You are sure to know that a point $M$ moving in a plane equidistantly
from two fixed points, say $F_1$, and $F_2$, of the same plane, that
is, so that $MF_{1}= MF_{2}$, describes a straight line (Fig. 2).

But you might find it difficult to answer the question:

What type of curve will point $M$ describe if the distance of $M$ from
$F_1$, is a certain number of times greater than that from $F_2$ (for
instance, in Fig. 3 it is twice as great)?

The curve turns out to be a circle. Hence if the point $M$ moves in a
plane so that the distance of $M$ from one of the fixed
points. $F_{1}$ or $F_{2}$, in the same plane is always proportional
to the distance from the other fixed point, that is

$$
MF_{1} = k \times MF_{2}
$$

then $M$ describes either a straight line (when the factor of
proportionality is unity) or a circle (when the factor of
proportionality is other than unity).


This is a post to create interactive mathematics elements using Cinderella a Free Software alternative to GeoGebra which is no longer a Free Software. The files have been exported from Cinderella at html interactives)

Algorithmic Nature

Such natural beauty! Does mathematics lie at the basis of these diverse and beautiful forms? Photo taken during summer of 2017 in Mumbai. None of these are native to India. On left: The Cannonball tree flower (Couroupita guianensis) is South and Central American, African Tulip Tree (Spathodea campanulata) native to tropical. Africa; On Right: The Cannonball tree flower, and Gulmohar is Madagascan (Delonix regia).

What could be more “organic” and “natural” than looking at a pristine forest with a variety of tree forms and leaf forms of various shapes and shades, with inflorescences of variety of shapes, sizes and colours? Mathematicians and physicists are often accused of being not able to enjoy nature and because mathematics and physical theory is so “abstract” and nature is so “organic”. Organic growth is in the form of variety of morphologies of roots, branches, flowers shapes and arrangement, leaf shapes and arrangements, while mathematics typically is abstract graphs, equations, symbols and numbers. How can these two possibly have anything in common? This has also to do with how biology is traditionally taught. While physics has mathematics at its foundation, the teaching of biology doesn’t acknowledge any need for mathematics – it is mostly descriptive as it was in its early stages a couple of centuries later. This is more so at the school level teaching of biology. So this creates an impression in the students and teachers alike that mathematics is not a part of “biological” nature and it is only reserved for falling bodies and ascending projectiles. 


What can be similarities in the two images? One is abstracted representation of motion of a body in algebraic and graphical format and other is organic growth of a plant showing its branching and similar leaves with its pigmentation of chlorophyll.

Of course the variety of forms and their classification is one of the foundations of biology. Linnaeus used the morphological differences and similarities to form his classification system.


Linnaean system brought order to seemingly diverse and chaotic forms of natural world. Linnaeus named the different forms. Naming is the first step in studying anything. Naming helps in categorisation, which is one of ways to formation of concepts. This led to further finer classification of the system as whole which now includes both flora and fauna. Then began the programme of finding organisms and classifying them in existing categories with descriptions – or creating new ones when the existing ones did not fit – became the normal way of doing biology in the nineteenth century. Even now finding a new plant or animal species is treated with celebrated as a new discovery. 

Darwin in his thesis about evolution by natural selection used the differences and similarities of the form as one of evidence. He theorised that organisms that have evolved from common ancestors will show similar forms with slight variations. Over long periods of time these slight variations evolve into larger variations which ultimately leads to a completely different species. Fossil records tell us about ancestors and current relatives of organisms.

There is grandeur in this view of life, with its several powers, having been originally breathed by the Creator into a few forms or into one; and that, whilst this planet has gone circling on according to the fixed law of gravity, from so simple a beginning endless forms most beautiful and most wonderful have been, and are being evolved. (emphasis added)

The morphologies tell us about related species, the ancestries and divergences from there. The fossils tell us the ancestors, the missing links. So finding organisms, both extant and extinct, to fit in the jigsaw puzzle of tree of life became the standard programme in biology. This enabled us to construct the tree of life. Ernst Haeckel’s version of the tree, depicted below, is highly anthropocentric which places humans at the apex of evolution. This is rather common misconception about evolution – humans are not at apex of evolution or the prime product of it as some would have us believe – we have co-evolved with all the current extant species. Evolution by natural selection is not anthropocentric, it is indifferent to humans and other organisms alike. Daniel Dennett likens it to universal acid, and makes a point that it is not only applicable to living systems, but applies to any system which fulfil the three required criteria. 


Haeckel’s – Pedigree of Man – a version of tree of life which is highly anthropocentric.

But can we make sense of similarities of the form in terms of mathematics? Can we find mathematical algorithms which will generate forms, as they generate trajectories of moving projectiles? Looking at similarities in form, it is Galileo who was one of the first to discuss the problem of scaling and its effect on form.

To illustrate briefly, I have sketched a bone whose natural length has been increased three times and whose thickness has been multiplied until, for a correspondingly large animals, it would perform the same function which the small bone performs for its small animal, From the figures here shown you can see how the proportion of the enlarged bone appears. 

Whereas, if the size of a body be diminished, the strength of that body id not diminished in the same proportion; indeed the smaller the body the greater its relative strength. Thus a small dog could probably carry on his back two or three dogs of his own size; but I believe that a horse could not carry even one of his own size.

At the start of twentieth century we had a few  classics which gave a strong mathematical flavour to the study of the biological forms and scaling – The Curves of Life by Theodore Cook (1914), D’arcy Thompson’s  On Growth and Form (1917) and  Julian Huxley’s Problems of Relative Growth (1932)

The kind of mathematical treatment that entered in study of biology by above classics looked at the mathematical aspects of morphological forms in organisms. The Curves of Life looks at the spiral forms which are found in nature, and also in various human creations – architecture and art. 

The spiral is one of the most easily identifiable mathematical forms in nature.
In many flowers, a double spiral forms the basis of the central pattern. The Fibonacci numbers are easily identifiable with this pattern.
The spiral is found in animals too, most easily identifiable in the shells of various types. They represent logarithmic spirals.


Despite tremendous success of Darwin’s theory, physics and mathematics were in a separate compartment from biology. There seemed to be no common elements, while biology became more and more descriptive with focus on the form, but not mathematical. 

The word “form” in this article will refer to the shapes of material objects, the arrangement in space of groups of them, and the arrangement in space of their component parts. Our appreciation of form is partly sensory, but we can be helped by measurement and calculation to gain some confidence that what we perceive is not entirely unconnected with the outside world. (Physical Principles underlying Inorganic FormS.P.F. Humphreys-Owen)

But this is a folly. Nature and organic growth is as mathematical as is the description of a projectile flying under gravity. Perhaps the mathematical description is 

The sparse branching of Frangipani (Plumeria sp.), a native of central America.
The dense branching of the Acacia (Vachellia nilotica) native to Africa, Middle East and India. Is the branching in Frangipani and Acacia related? What about the branching in grass in the figure at top? Can these be generated from a single mathematical algorithm? And why do only these forms are found and not any other?

In my experience a lot of young children who take to biology do so because they hate mathematics or computations. In India there are even streams at +2 level which allow you to shun mathematics for biological subjects. This utter hatred for mathematics is, IMHO, due to a carelessly designed and too abstracted mathematics curriculum at the school level – a curriculum which takes out the soul of mathematics and puts on a garish display of the cadaver of mathematics with bells and whistles. But this post is not about the problems of mathematics education, I have talked about it elsewhere.


The aim of this series of posts is to touch upon the inherent mathematics and algorithms in the natural world. How nature is mathematical especially in living and non-living things. How can algorithms generate natural forms? In the next posts in this series we will explore how the ideas of mathematical models can explain the variety of forms that result from natural selection in environment and possibly why only those forms can be found. 

Note: All photographs were taken by me over the years. Only now I am able to piece a narrative linking them together.


Dialectic vs Algorithmic Mathematics

Dialectic mathematics is a rigorously logical science, where statements are either true or false, and where objects with specified properties either do or do not exist. Algorithmic mathematics is a tool for solving problems. Here we are concerned not only with the existence of a mathematical object, but also with the credentials of its existence. Dialectic mathematics is an intellectual game played according to titles about which there is a high degree of consensus. The rules ol the game of algorithmic mathematics vary according to the urgency of the problem on hand. We never could have put a man on the moon if we had insisted that the trajectories should be computed with dialectic rigor. The rules may also vary according to the computing equipment available. Dialectic mathematics invites contemplation. Algorithmic mathematics invites action. Dialectic mathematics generates insight. Algorithmic mathematics generates results.

Implicit cognition in the visual mode

Images become iconified, with the image representing an object or
phenomena, but this happens by enculturation rather by training. An
example to elaborate this notion is the painting Treachery of
Images by Belgian surrealist artist René Magritte. The painting is
also sometimes called This is not a pipe. The picture shows a
pipe, and below it, Magritte painted, “Ceci n’est pas une pipe.”,
French for “This is not a pipe.”
176
When one looks at the painting, one
exclaims “Of course, it is a pipe! What is the painter trying to say
here? We can all see that it is indeed a pipe, only a fool will claim
otherwise!” But then this is what Magritte has to say:

The famous pipe. How people reproached me for it! And yet, could you
stuff my pipe? No, it’s just a representation, is it not? So if I had
written on my picture `This is a pipe’, I’d have been lying!

Aha! Yess! Of course!! you say. “Of course it is not a pipe! Of
course it is a representation of the pipe. We all know that! Is this
all the painter was trying to say? Its a sort of let down, we were
expecting more abstract thing from the surrealist.” We see that the
idea or concept that the painting is a \emph{representation} is so
deeply embedded in our mental conceptual construct that we take it for
granted all the time. It has become so basic to our everyday social
discourse and intercourse that by default we assume it to be so. Hence
the confusion about the image of the pipe. Magritte exposes this
simple assumption, that we so often ignore. This is true for all the
graphics that we see around us. The assumption is implicit in all the
things we experience in the society. The representation becomes the
thing itself, for it is implicit in the way we talk and communicate.
Big B and D
When you look at a photo of something or someone, you recognize
it. “This is Big B!” you say looking at the painting! But then you
have already implicitly assumed that the representation of Big B is Big B. This implicit assumption comes from years of implicit training from being submerged in  the sea of the visual artefacts that surround and drown us. This association between the visual representation and the reality it represents had become the central theme of the visual culture that we live in. The training that we need for such an association comes from the peers and mentors that surround us from the childhood. The meaning and the association of the images is taught/caught over the years, so much so that we assume the abstract association is the normal way things are. In this way it becomes the implicit truth, though when one is pressed, the explicit connections are brought out.
Yet when it comes to understanding images in science and mathematics, the same thing doesn’t happen. There is no enculturation of children into understand the implicit meaning in these images. Hardly there are no peers or mentors whose actions and practices can be imitated by the young impressible learners. The practice which comes so naturally in other domains (identifying actor with a picture of the actor, or identifying a physical space with a photo) doesn’t happen in science and mathematics classrooms. The notion of practice is dissociated from the what is done to imbibe this understanding in the children. A practice based approach where the images become synonymous with their implied meaning is used in vocabulary might one very positive way out, this is after all practitioners of science and mathematics learn their trade.